Cortex: horizontally scalable, highly available, multi-tenant, long term storage for Prometheus
- GeekGuy
- Dec 2, 2021
- 5 min read
Updated: Jun 24, 2022
What is Cortex?
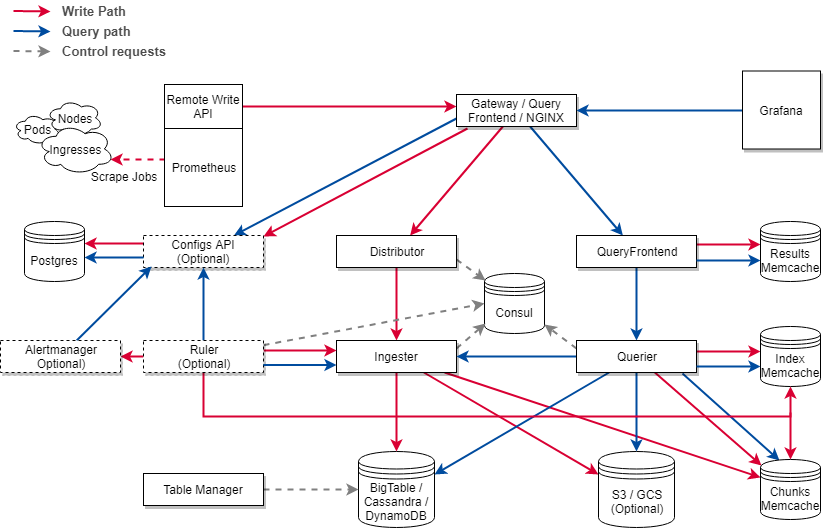
Cortex is a CNCF sandbox project that seeks to provide long term storage and a global metrics view for metrics scraped using Prometheus. Prometheus has become the default monitoring applications and systems in a cloud-native world. For any real-world use case, Prometheus should be highly available which has it’s set of challenges. Once you run Prometheus in HA mode there are a bunch of issues such as data duplication, achieving single pane of glass for duplicate data, etc. To solve this problem Cortex was born.

Why do we need Cortex?
Make Prometheus High availability for monitoring & avoid Data De-duplication.
Global metrics view — This provides us with a central location where we can observe the metrics of our entire infrastructure.
Long term storage — Prometheus’s local storage is not meant as durable long term storage. Metrics sent to the cortex are stored in the configured storage service.
Optionally, Cortex also supports Object Stores for storing chunk — GCS, S3
Thanos vs Cortex — differences and similarities
Thanos and Cortex have very similar goals to aggregate metrics, store them in block storage and have a single pane of glass for all your metrics. Thus, it’s no surprise that both projects reuse a lot of Prometheus code. However, there are a few key differences that may help you decide to use one of them over the other.
Cortex | Thanos |
Recent data stored in injestors (A Cortex Component) | Recent data stored in Prometheus |
Use Prometheus write API to write data at the remote location | Use sidecar approach to write data to a remote location |
HA is supprted | HA is supported |
Single setup can be integrated with multiple Prometheus | Single setup can be associated with single Prometheus |
Only Egress is required from cluster running Prometheus | Requires Ingress to cluster in which Prometheus is running for querying |
Indexed chunks | Prom TSDB blocks |
Cortex Installation
Cortex can be easily installed by using Helm package manager in Kubernetes. So, we will use the standard helm chart created by the Cortex team, but before we have to install consul inside the cluster as the data store.
$ helm repo add hashicorp https://helm.releases.hashicorp.com
$ helm search repo hashicorp/consul
$ helm install consul hashicorp/consul --set global.name=consul --namespace cortex
Now we have the data store in-place, we need to configure the storage gateway to connect with a remote storage backend. We decided to go ahead with the S3 bucket in AWS. So we have to customize the default values file of Cortex according to our use-case, you can find the values file here and you need to add your service account under blocks_storage of the config.
$ helm repo add cortex-helm https://cortexproject.github.io/cortex-helm-chart$ helm install cortex --namespace cortex -f my-cortex-values.yaml cortex-helm/cortexHere we are pretty much done with the cortex setup and now it’s time for configuring the Prometheus to connect with Cortex. Now you can verify the consul and cortex nodes by using kubectl.

Prometheus Configuration
For configuration of the Prometheus. We just have to add these lines of the block in our prometheus.yaml file. The remote write and read API is part of Prometheus to send and receive metrics samples to a third-party API, in our case Cortex.
remote_write:
   url: http://cortex.cortex/api/prom/push
Here, we are adding stable helm charts default repository, so we can search & install stable chart from it.
$ helm repo add stable https://charts.helm.sh/stable
$ helm install stable prometheus-community/kube-prometheus-stack -f values.yaml
Now you can verify the Prometheus and Grafana nodes by using kubectl. Once we are done with changes in Prometheus, we can go to the S3 bucket to validate the data creation.
PoC — Prometheus Integration with Cortex
You can either instrument your application with the language APIs and their in-process exporters to send metrics data to a Prometheus backend or you can use the OpenTelemetry Collector with its out-of-process exporters to send metrics data to a Prometheus backend. In this exercise, we are going to use a metrics instrumented application with the OpenTelemetry collector.
Here you can see the OpenTelemetry collector ConfigMap, Deployment and the Service that you need to use.
apiVersion: v1
kind: ConfigMap
metadata:
  name: collector-config
data:
  collector.yaml: |
    receivers:
      otlp:
        protocols:
          grpc:

    processors:
      batch:

    exporters:
      logging:
      prometheus:
        endpoint: 0.0.0.0:8889
        namespace: cortex

    service:
      pipelines:
        traces:
          receivers: [otlp]
          processors: [batch]
          exporters: [logging]
        metrics:
          receivers: [otlp]
          processors: [batch]
          exporters: [logging,prometheus]
OTEL Collector Config Map YAML
apiVersion: apps/v1
kind: Deployment
metadata:
  name: otel-collector
spec:
  replicas: 1
  selector:
    matchLabels:
      app.kubernetes.io/name: otel-collector
  template:
    metadata:
      labels:
        app.kubernetes.io/name: otel-collector
    spec:
      containers:
      - name: otelcol
        image: otel/opentelemetry-collector:0.27.0
        args:
        - --config=/conf/collector.yaml
        - --log-level=debug
        volumeMounts:
        - mountPath: /conf
          name: collector-config
      volumes:
      - configMap:
          items:
          - key: collector.yaml
            path: collector.yaml
          name: collector-config
        name: collector-config
OTEL Collector Deployment YAML
apiVersion: v1
kind: Service
metadata:
  annotations:
      serviceloadbalancer/lb.cookie-sticky-session: "false"
  name: otel-collector
spec:
  ports:
  - name: grpc-otlp
    port: 4317
    protocol: TCP
    targetPort: 4317
  - name: prome-otlp
    port: 8889
    protocol: TCP
    targetPort: 8889
  selector:
    app.kubernetes.io/name: otel-collector
  type: LoadBalancer
OTEL Collector Service YAML
The exporters: section is how exporters are configured. Exporters may come with default settings, but many require configuration to specify at least the destination and security settings. Any configuration for an exporter can be done in ConfigMap. Here we use prometheus exporter to export metrics from the application. Now you can create OpenTelemetry collector ConfigMap, Deployment and the Service resources using
$ kubectl create -f FILENAMEand verify the Prometheus, Grafana and OpenTelemetry collector pods by using kubectl.

Before deploying PoC we will configure Prometheus to scrape this new otel-collector target. In Prometheus terms, an endpoint you can scrape is called an instance, usually corresponding to a single process. A collection of instances with the same purpose, a process replicated for scalability or reliability for example, is called a job. To achieve this, add the following job definition to the scrape_configs section in your prometheus.yml and restart your Prometheus instance.
- job_name: 'otel-collector'
        scrape_interval: 2s
        static_configs:
          - targets:
            - <ip_address>:8889
Please note that you must replace <ip_address> with your EXTERNAL-IP of the otel-collector service.
$ helm delete stable --namespace cortex$ helm install stable prometheus-community/kube-prometheus-stack --namespace cortex -f values.yamlNext, You have to clone and configure the PoC which generate metrics. This is a metrics instrumented application which export metrics to OpenTelemetry collector through the agent.
$ git clone https://github.com/open-telemetry/opentelemetry-collector.git$ cd opentelemetry-collector/examples/demo/Change the otlp exporter endpoint in OpenTelemetry agent according to your external-ip of the collector service and run the application using docker-compose.yaml
$ docker-compose upNext you need to use port forwarding to access Prometheus and Grafana dashboards in the cluster.
$ kubectl port-forward svc/prometheus-server 3000:80 -n cortexOpen new terminal window and forward a local port to a port on the Grafana service
$ kubectl port-forward svc/stable-grafana 8080:80 -n cortexNavigate to Prometheus dashboard on http://127.0.0.1:3000/ click status drop-down on the navigation bar and select target then search otel-collector target.

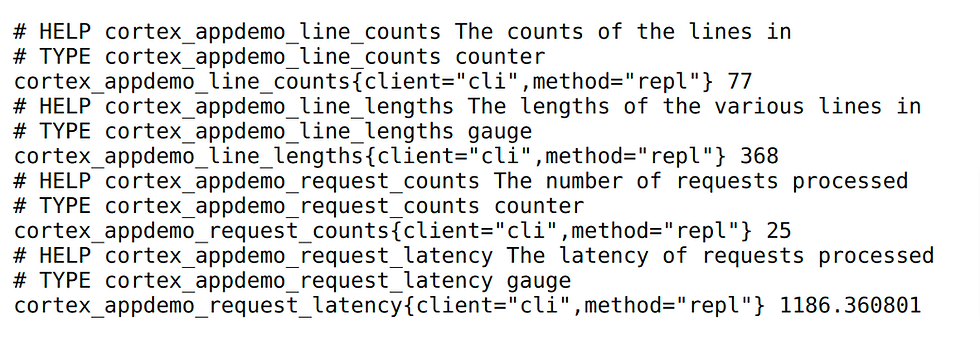
Navigate endpoint of the otel-collector job and you will be able to see the all the metrics that generated from the application.

Verify metrics from Grafana
After we need to setup Grafana Metrics Dashboard from Prometheus data source. To create a Prometheus data source navigate to Grafana application on http://127.0.0.1:8080/ and login. Default login is admin. But there is no default password — it’s generating if it’s not set and stored inside secretes. You can read it in this way:
$ kubectl get secret --namespace cortex grafana -o jsonpath="{.data.admin-password}" | base64 --decode ; echoAfter we need to setup Grafana Metrics Dashboard from Prometheus data source. You can create a data source with Prometheus data source type.
1.Click on the “cogwheel” in the sidebar to open the Configuration menu.
2. Click on “Data Sources”.
3. Click on “Add data source”
4. Select “Prometheus” as the type.
5. Set the appropriate Prometheus server URL.
6. Adjust other data source settings as desired.
7. Click “Save & Test” to save the new data source.
You can find the URL and the access mode below.
After we need to setup Grafana Metrics Dashboard from Prometheus data source. You can create a data source with Prometheus data source type. You can find the URL and the access mode below.
The URL     : http://cortex-query-frontend-headless:8080/prometheus
Access Mode : "server (default)"
Let’s start with adding a panel to show the request latency of the PoC. Press ‘Add Query’ on the panel and fill in the query using cortex_appdemo_request_latency metric. Then click save and apply buttons you will be able to see the metric dashboard.
Let’s start with adding a panel to show the request latency of the PoC. Press ‘Add Query’ on the panel and fill in the query using cortex_appdemo_request_latency metric. Then click save and apply buttons you will be able to see the metric dashboard.


Can you share the latest cortex chart values. its not working for the latest version